Python for Data Science Your Career Path to Get Hired in 2026
Why Python for Data Science
Are you thinking about a new career path in data science? It’s a smart choice. Data science jobs are growing fast in 2026, making it an exciting field for many people looking to switch careers or find good remote work opportunities. Actually, data science roles are among the fastest-growing jobs around, with a projected growth rate through 2029 [^2].
Here’s the thing: you’ll need the right tools to succeed, and that’s where Python comes in. Python for data science is like a superpower. It’s known for being easy to learn and powerful at the same time. This makes it the top choice for people who work with data to find patterns and make smart guesses about the future [^1]. Because so many companies use Python, learning it opens up lots of doors, especially for remote jobs [^4].
This guide is for anyone who wants to learn how to use Python to get into data science.

Maybe you’re tired of your current job and want something new and challenging. Or perhaps you’re looking for flexible remote work that pays well. We get it. We’ll show you the common steps people take to start a data science career. You’ll learn what skills employers are really looking for in 2026 [^8].
It’s not always super quick, but with the right focus, you can get there. You’ll need to learn important ideas and tools, starting with python basics. This guide will give you a clear, step-by-step plan. We’ll focus on the actual skills you need, the tools you’ll use every day, and how to build projects that show employers you’re ready to work. Think of it as your map to unlocking exciting opportunities in data science. If you are looking to acquire new skills for a remote career, understanding the right courses can make a big difference, similar to how one might unlock high-paying remote jobs with the best appointment setter courses. We want to help you make a smooth switch and build a great career.
Data science is a booming field, and in 2026, it offers many exciting paths for those looking to make a career switch. But what exactly do these jobs involve, and what do companies expect? Let’s explore the data science landscape, focusing on roles that often use python for data science, what employers are looking for, and how to snag those remote opportunities.
Different Data Science Jobs Where Python Helps
Not all data science jobs are the same. Each has a special focus, but they all share the need for someone to understand data. Python is a key tool in nearly all of them.
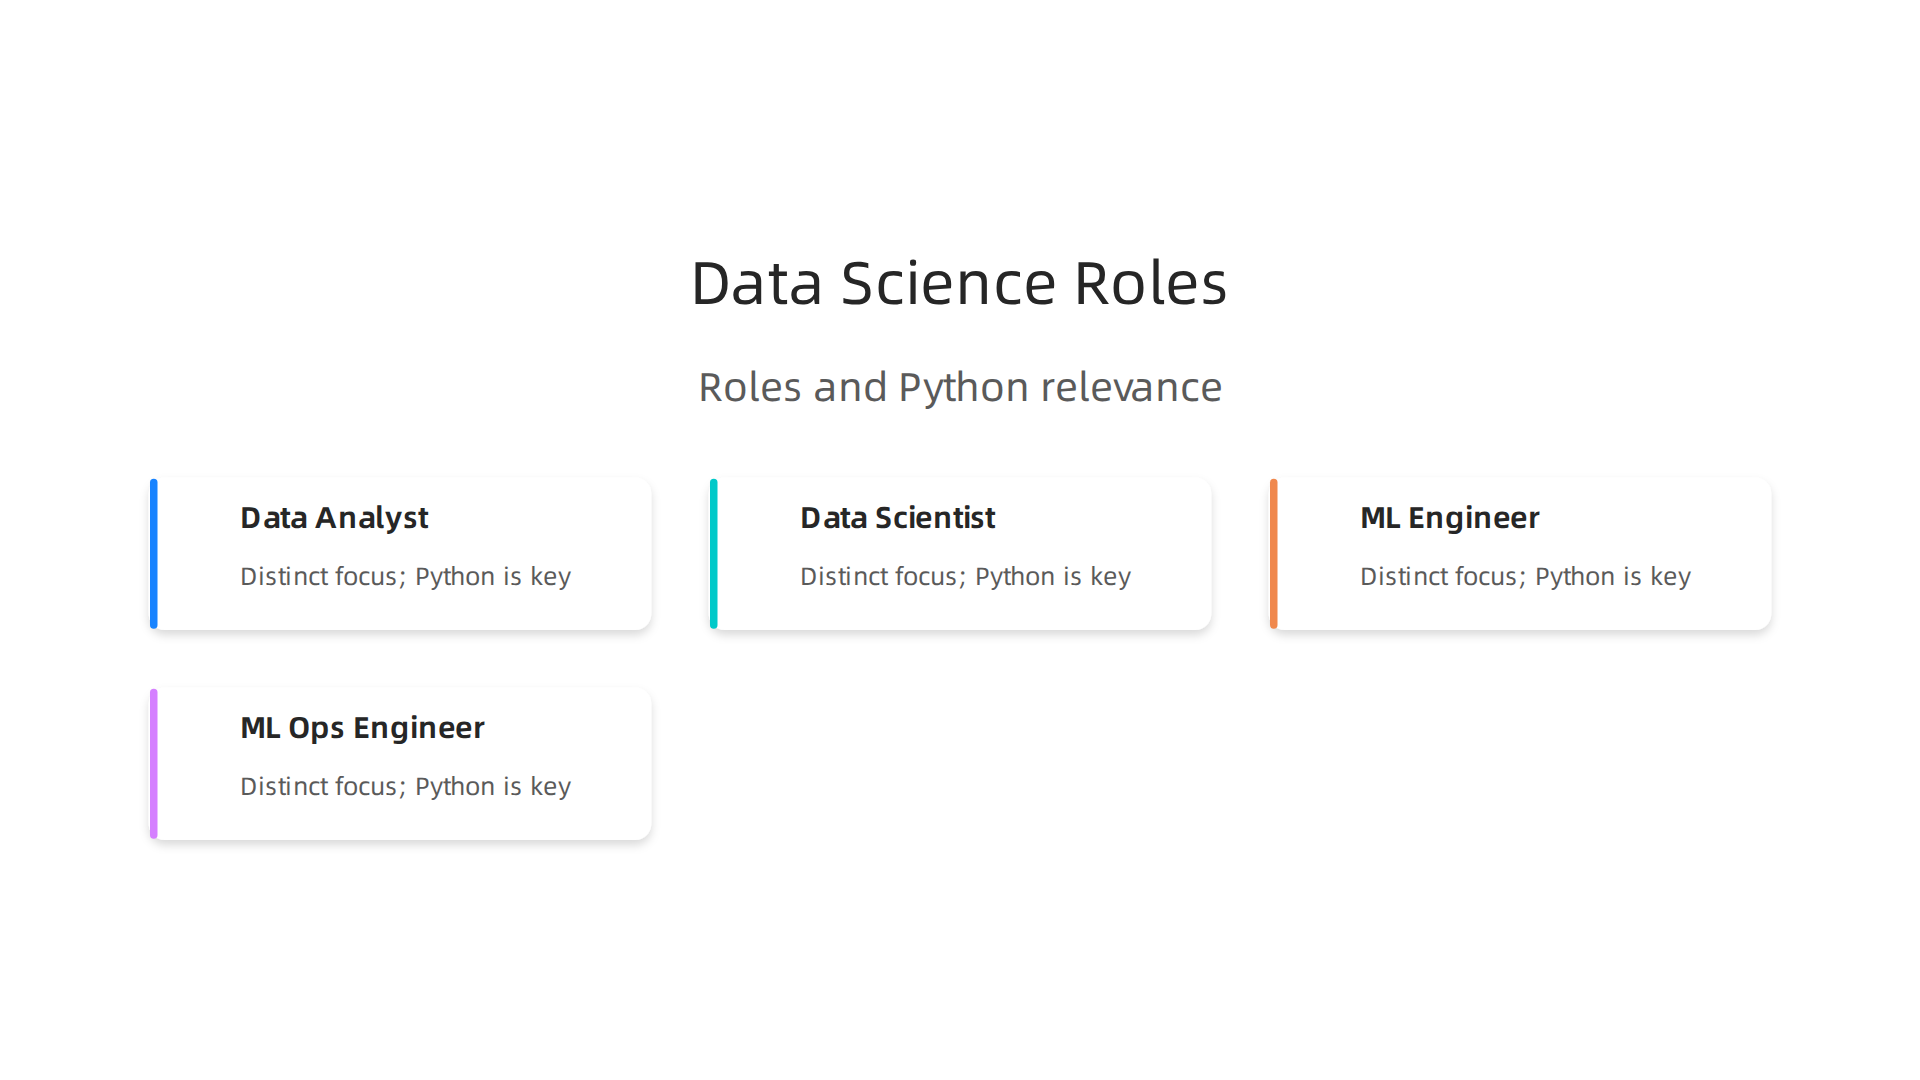
- Data Analyst: This is often where many people start. Data analysts clean and organize data to find interesting facts and trends. They use python for data analysis to make reports and dashboards that help businesses understand what’s happening. They might use basic Python commands and tools to prepare data for graphs and summaries.
- Data Scientist: These roles go deeper than analysts. Data scientists not only find facts but also build models to predict future events. They use python for data science to create complex algorithms and machine learning models. This involves stronger python basics and understanding how to use different libraries.
- Machine Learning (ML) Engineer: These professionals focus on taking the models built by data scientists and making them work in real-world products. They write clean, efficient Python code to ensure that AI and ML systems run smoothly. This often involves putting models into production so many users can benefit from them.
- ML Ops Engineer: This role is about managing the process of building, deploying, and monitoring machine learning models. They use Python for automation and to make sure that ML models are always working well.
It’s important to know that these roles can sometimes mix, especially in smaller companies. One person might do a bit of everything, making versatile skills like python for data science even more valuable. Research shows a rapid growth in these data science jobs [^1].
What Employers Expect in 2026
When you’re looking for a data science job, especially a remote one, employers look for specific skills. For entry-level positions, they want to see that you understand python basics. This means you can write simple scripts, clean data, and maybe do some basic data visualization. They also want to see that you can think clearly about problems and use data to solve them. Think about showing how you might use a python for loop to process lists of information or how to enumerate python objects in a collection.
For junior roles, companies expect more. You should be able to work more independently, build slightly more complex models, and know how to fix common issues. In 2026, skills in IT and AI are highly sought after, and this affects how companies hire [^8].
For remote jobs, showing what you can do is extra important. Because you’re not in the office, employers need to trust that you can complete tasks on your own. This makes having clear proof of your skills vital.
How to Get Hired: Portfolios, Projects, and Certifications
To land a job in data science, especially a remote one, you need to stand out. Here’s how:
- Projects and Portfolio: This is perhaps the most important part. A portfolio shows off real projects you’ve worked on. These projects don’t have to be perfect, but they should show how you used python for data science to solve a problem. You can put your code on platforms like GitHub. Projects prove you can actually do the work, not just talk about it. Maybe you have a project where you used Python to analyze sales data or predict stock prices. Learning how to add progress bars to your scripts, for example, can make your projects look more professional and user-friendly, and you can learn how to do that by checking out how to master tqdm, the simple way to add Python progress bars.
- Certifications: Getting certifications from online courses can also help. They show that you’ve put in the effort to learn and have verified skills. Many popular platforms offer courses that teach python basics, much like how one might learn from guides such as W3Schools Python. A certificate can give you an edge, especially when first starting out.
- Hiring Channels: Many jobs are found through online job sites and networking. Looking at what companies are asking for in job descriptions will give you a good idea of which skills to focus on. Analyzing job market data from these online portals is a key part of understanding current trends [^3].
By focusing on these areas, you can build a strong profile that appeals to employers looking for new talent in the exciting world of data science.
2. Python Core Skills Every Beginner Should Master (Syntax, Data Types, Functions, Modules)
To truly make your mark in python for data science, you need to start with strong basics. Think of it like building a house. You wouldn’t start with the roof before the foundation, right? Good Python basics are your foundation. They make your code easy to read, simple to fix, and work well with others.
Key Python Basics You Need
First, get comfortable with the very core of Python. This includes:
- Syntax: This is like the grammar of Python. You learn how to write commands so the computer understands them.
- Data Types: Python uses different kinds of data, like numbers (integers, decimals), text (strings), and lists of items. Knowing these helps you pick the right way to store information.
- Variables: These are like labels you give to data. You use them to store values that can change.
- Control Flow: This means making your code do different things based on conditions. For example, a
python for looplets you do something many times, like checking every item in a list. You might also need to learn how toenumerate pythonobjects to keep track of their order. - Functions: These are blocks of code that do a specific job. You can call them whenever you need that job done, which saves you from writing the same code over and over.
- Modules and Libraries: As you get better, you’ll use pre-written code collections called modules or libraries. These are huge time-savers for data science tasks. A good place to start learning these basics is through official Python tutorials or beginner guides like those found on W3Schools Python
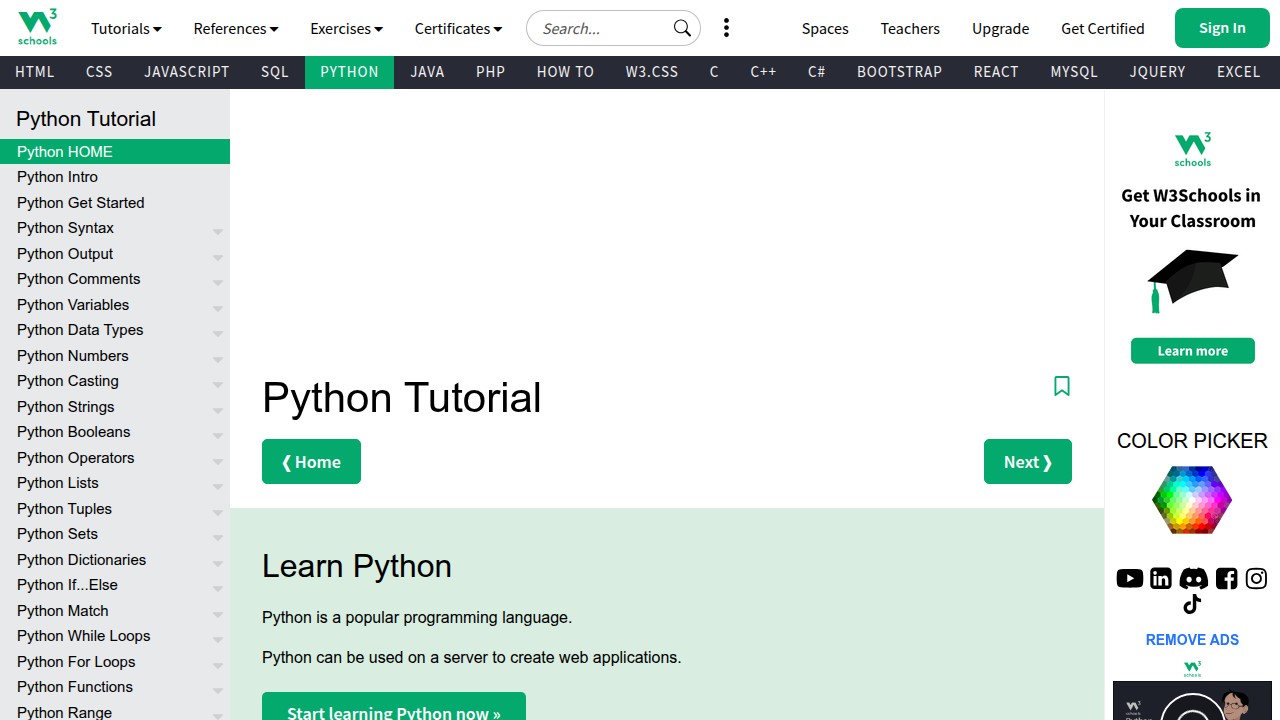
[^9].
Why Fundamentals Matter for Data Science
Having solid python basics isn’t just about writing code that works. It’s about writing code that works well and can be shared.
- Readability: If your code is messy, it’s hard for you and others to understand later. Clean code helps everyone.
- Reproducibility: Good code means someone else can run your work and get the same results. This is very important in data science.
- Collaboration: Data science projects often involve teams. When you know proper coding practices, you can work smoothly with other data scientists or engineering teams. This includes using tools like version control (like GitHub) to keep track of changes and good code style (how you arrange your code).
Your Learning Path
To master python for data science, follow these steps:
- Start with the very basics: Understand syntax, data types, variables, loops, and functions. Many free courses can guide you from beginner to expert [^3].
- Practice often: The more you code, the better you’ll get. Try solving small problems.
- Learn key libraries: Once you have the basics down, dive into libraries essential for data science. These include:
- NumPy: Great for working with numbers and arrays [^10]. You can find many tutorials on their website [^5].
- Pandas: Perfect for handling and cleaning data in tables [^6].
- Scikit-learn: Used for building machine learning models [^8].
These libraries are often covered in full Python for Data Science courses [^2].
- Work on small projects: Apply what you learn. Remember, making your projects look professional, even with small touches like progress bars, can make a big difference. If you want to see how to do that, you can check out how to master tqdm, the simple way to add Python progress bars.
- Seek feedback: Ask others to look at your code. This helps you learn and improve your coding style.
3. Data Wrangling with Python: pandas, Cleaning, Validation, and Reproducible Pipelines
So you’ve got your Python basics down. That’s a great start! Now, imagine you have a big box of LEGOs, but they’re all mixed up with other random toys, some broken pieces, and dirt. Before you can build anything cool, you need to sort through them, clean them, and make sure you have all the right pieces. This is what data wrangling is all about for python for data science. It means taking raw, messy data and getting it ready for analysis.
Why Data Wrangling is Super Important
In the real world, data rarely comes in a neat, clean package. It often has missing parts, wrong formats, or extra bits you don’t need. Data wrangling is key because it makes sure your data is reliable. If your data isn’t clean, any insights or models you create will be flawed. Think of it: "Garbage in, garbage out!"
The main tool for data wrangling in python for data science is the Pandas library. It’s like a superpower for working with table-like data, much like what you see in spreadsheets. Pandas helps you read data, clean it, and change it how you need (pandas 3.0.2 documentation).
Core Ways to Work with Data Using Pandas
With Pandas, you can do many helpful things:
- Reshaping Data: Sometimes your data is laid out in a way that’s hard to work with. Pandas lets you "reshape" it, like turning a long list into a wide table, or vice versa. This is useful for getting your data into the perfect format for your next steps.
- Merging Data: Imagine you have customer information in one file and their purchase history in another. Pandas lets you combine these files based on a shared piece of info, like a customer ID. This creates one big, useful dataset.
- Group Operations: What if you want to find the total sales for each product category? Or the average age of customers from different cities? Pandas can group your data and then do calculations on those groups. It’s like putting all similar items together and then counting them up.
Cleaning and Checking Your Data
Once you start using Pandas, you’ll spend a lot of time cleaning and checking your data. This is crucial:
- Handling Missing Data: Often, some cells in your data will be empty. Pandas helps you find these missing spots and decide what to do. You might fill them in with an average value, or simply remove the rows with too much missing information.
- Checking Data Types: Is a column of numbers actually being treated as numbers, or is Python seeing them as text? If they’re text, you can’t do math with them! Pandas helps you make sure each column has the right data type.
- Validating Data: This means checking if your data makes sense. For example, if you have an "age" column, you might want to make sure all ages are positive numbers and not something like "hello" or "500". This ensures your data follows rules you set.
Making Your Work Reproducible
A big part of modern python for data science is making your work reproducible. This means someone else (or even you, months later) can follow your steps exactly and get the same results. To do this, you’ll often use notebooks (like Jupyter Notebooks) or Python scripts. These are like a detailed recipe where every step of your data wrangling, cleaning, and analysis is written down in code. A good example of a full data pipeline, including these steps, can be found in hands-on tutorials (Python for Data Science: NumPy, Pandas and Scikit-Learn in 2026).
A Simple Project Idea
To get started, try this:
- Find a small, messy dataset online. A good example would be a simple CSV file with sales figures, or customer details that might have empty cells or wrong spellings.
- Load this data into a Pandas DataFrame.
- Practice finding and fixing missing values.
- Try to change the data types of one or two columns.
- Perform a simple group operation, like finding the sum of sales per region.
Working through a project like this from start to finish will really cement your python basics in a practical way. For more detailed learning, you can always find a full python for data science course online that covers these libraries in depth (Python For Data Science Full Course 2026 [FREE]).
Now that your data is all clean and tidy, what do you do with it? You show it off! This is where visualization comes in. Visualization means making pictures from your data, like charts and graphs. It helps you understand what your data is telling you, and it helps you explain your findings to others. For anyone learning python for data science, making good pictures is super important.
Why Pictures Help So Much
Imagine you have a big list of numbers. It’s hard to see what’s happening, right? But if you turn those numbers into a bar chart or a line graph, you can quickly spot trends, big differences, or problems.
Here’s why visualization is a big deal in python for data science:
- Find Hidden Stories: Charts can show you things in your data you might never see in a table of numbers. They help you find patterns and insights faster.
- Talk to Others: Most people understand pictures better than complicated tables or code. Good charts help you share your ideas with bosses, teammates, or customers. It’s how you tell a clear story with your data.
- Show Your Work: If you’re looking for a job in
python for data science, nice charts are great for your portfolio. They show that you can not only work with data but also make it easy for anyone to understand.
Tools for Making Pictures with Python
Python has some really helpful tools, also called libraries, for making charts. Let’s look at the main ones:
-
Matplotlib and Seaborn: Think of these as your basic drawing tools.
- Matplotlib is like a pencil and paper. It gives you a lot of control to draw almost any kind of chart you want. You often use it for quick looks at your data or for making simple pictures for reports. It’s a key part of your
python basicsfor visualization. - Seaborn builds on Matplotlib. It’s like having fancier pens and rulers. Seaborn makes beautiful charts with less code, which is great for statistical plots. It’s often used when you want a chart to look really nice without much effort.
- These tools are best for static charts. This means the pictures don’t move or change. You print them or put them in a report, and they stay the same.
- Matplotlib is like a pencil and paper. It gives you a lot of control to draw almost any kind of chart you want. You often use it for quick looks at your data or for making simple pictures for reports. It’s a key part of your
-
Plotly: Now, imagine a magic drawing board where your pictures can move!
- Plotly helps you make interactive charts. This means someone looking at your chart can zoom in, pan around, or click on parts of the chart to see more details.
- Plotly is great for things like dashboards on websites or reports where people want to explore the data themselves. It’s very useful when you want to show your data to a product team or a customer who needs to play with the numbers.
Actually, the Pandas library you used for cleaning data can also help with some basic visualization, tying into a full data process from munging to visual insights (Learning The Pandas Library Python Tools For Data Munging Analysis And Visual).
A Simple Way to Go from Data to Charts
Here’s a quick plan for making your data shine:
- Get Clean Data: Start with the clean data you prepared using Pandas. This is your foundation.
- Ask a Question: What do you want to show or learn from your data? (e.g., "Which product sells the most?")
- Pick the Right Chart:
- To compare things, use a bar chart.
- To see changes over time, use a line chart.
- To show parts of a whole, use a pie chart.
- Code It Up: Use Matplotlib or Seaborn for quick, static charts. If you need something clickable, go for Plotly. You’ll use your
python basicsto write the code. - Make It Easy to Read: Add titles, labels for your axes, and a legend if needed. Make sure colors are clear.
- Share Your Story: Save your chart as a picture, or if it’s interactive, share the web link.
When you are writing longer Python code for your data analysis, you might even find it helpful to track how long certain parts take. For general python for data science tasks, tools that show progress can be quite useful. You can learn more about how to add useful progress bars to your Python scripts by checking out our guide on how to Master TQDM: The Simple Way to Add Python Progress Bars. This helps you keep an eye on your code as it runs.
Now that you’ve mastered cleaning your data and making cool pictures from it, you might hear big words like "Machine Learning." This is the next step for many people learning python for data science. So, when is the right time to learn it, and what should you start with?
Think of machine learning (ML) as teaching a computer to learn from data, just like a child learns from examples. Once it learns, it can make smart guesses or find hidden groups.
What Is Machine Learning?
At its heart, machine learning helps computers do things without being told every single step. Instead, we give them lots of data, and they find their own rules. Here are the simple ideas you should know:
- Supervised Learning: This is like learning with a teacher. You give the computer examples that already have the right answers. For instance, you show it many pictures of cats and dogs, and you tell it which are cats and which are dogs. Then, when you show it a new picture, it can guess if it’s a cat or a dog. This is great for making predictions, like predicting house prices or if a customer will buy something.
- Unsupervised Learning: This is like learning without a teacher. You give the computer data without any answers, and it tries to find patterns or groups on its own. Imagine giving it a bunch of customer information and asking it to find different types of customers without telling it what those types are. It can find similarities and put people into groups.
- Model Evaluation: After the computer learns, how do you know if it’s doing a good job? You need to check its work. This is called model evaluation. It means seeing how well your computer’s "guesses" match the real answers.
- Feature Engineering: This is about making your data extra good for the computer to learn from. Sometimes, you need to create new information from your existing data that helps the machine learn better.
Good Tools for Learning ML with Python
Python has awesome tools for machine learning. The most popular one for beginners is called Scikit-learn. It’s like a big toolbox filled with different ways to teach your computer. You can use it for many common ML tasks without needing to know super complex math right away. Other powerful tools often used alongside it include Keras and TensorFlow, which are great for more advanced learning, but Scikit-learn is a fantastic place to begin your journey in python for data science (Aurélien Géron, "Hands-on Machine Learning with Scikit-Learn, Keras, and TensorFlow"). It helps you practice your python basics in a new way.
When to Start Learning ML
It’s a good idea to build a strong foundation first. Make sure you are comfortable with:
- Python Basics: You should know how to use loops, write functions, and understand different data types.
- Data Cleaning and Organizing: Remember what we talked about with Pandas? You need to be good at getting your data ready.
- Data Visualization: Being able to make clear charts helps you understand your data before you try to teach a computer with it.
Once you feel solid in these areas, you’re ready to add machine learning to your skills. Start with simple projects, like making a model that guesses if a number is even or odd, or predicting how much a small object weighs based on its size. These practical steps help you build your python for data science portfolio and show that you can not only work with data but also make it smart. Learning ML is a great way to grow your career opportunities in 2026.
6. Tooling, platforms and workflow: notebooks, version control, cloud basics and deployment options
Alright, so you’ve learned about machine learning and when to dive in. Now, how do you actually do all this python for data science stuff? You need the right tools and a smart way to work. Think of it like a builder needing a hammer and a plan. In 2026, there are some great tools that make learning and working with data science much easier.
Your Data Science Toolbox: Essential Tools
When you’re starting out, a few key tools will help you organize your projects and write your code.
- Jupyter Notebooks: These are super popular for
python for data science. Imagine a special notebook where you can write code, run it, see the results (like charts or numbers), and write notes all in one place. It’s like a digital lab book. Many learning materials, including those for Scikit-learn, even come with Jupyter tutorials to help you get started [Aurélien Géron, "Hands-on Machine Learning with Scikit-Learn, Keras, and TensorFlow"]. They’re perfect for trying out ideas and showing your work. - VS Code: This is another great tool called an "Integrated Development Environment" or IDE. It’s like a super-powered text editor where you write your Python code. It helps you find mistakes and keeps your files neat. You can use it for bigger projects where you might have many Python files.
- Version Control (Git): Have you ever saved many versions of a document like "my_project_final.py", "my_project_really_final.py", "my_project_final_v2.py"? Git solves this. It’s a system that helps you track all the changes you make to your code over time. This means you can go back to older versions if you make a mistake, and it’s awesome for working with others. It’s an important part of a professional
python for data scienceworkflow.
To use these tools well, you’ll want a solid understanding of your python basics. Things like knowing how a python for loop works or how to use a library like tqdm to show progress bars in your scripts are super helpful when you’re writing code in these environments. If you want to make your Python scripts feel more professional, consider learning how to Master TQDM: The Simple Way to Add Python Progress Bars.
Cloud Basics for Data Scientists
As you learn more, you might hear about "the cloud." This just means using computers on the internet instead of only your own machine. Why is it useful?
- More Power: Sometimes, your computer isn’t strong enough for very big data tasks. Cloud platforms let you use much more powerful computers for a short time.
- Sharing and Collaboration: It’s easier to share your projects and work with others when your code and data are in the cloud.
- Remote Work: Learning cloud basics is very helpful for remote data analyst jobs in 2026, as many companies use these platforms for their work This is how you’ll become a REMOTE Data Analyst in 2026 (FULL … – YouTube.
For beginners, a great cloud option is Google Colab. It’s like a free, cloud-based Jupyter Notebook that works right in your web browser.
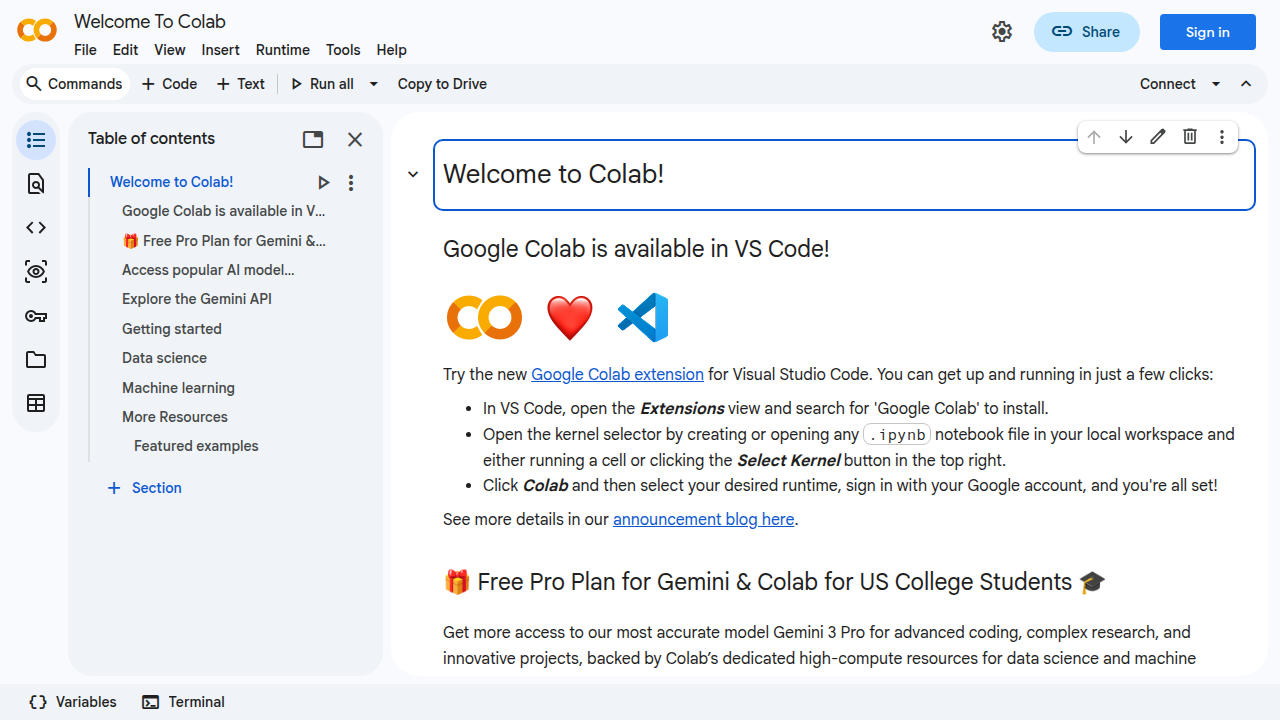
You don’t need to install anything or worry about expensive setup. It lets you get started with cloud computing without heavy investment.
Making Your Projects Shine: From Code to Sharing
When you build python for data science projects, you don’t just want them to sit on your computer. You want to share them or make them useful.
- Simple Packaging: As you get better, you can learn to "package" your code. This means organizing it so others can easily install and use your tools. It’s like putting all the pieces of a toy into one box with instructions.
- Sharing Dashboards: For many data science projects, the final step is to show what you found. Tools that let you create simple dashboards or interactive reports are excellent. They allow people who don’t code to understand your insights.
By using these tools and thinking about how to share your work, you’ll make your projects more complete and professional. This also helps build a strong portfolio for future career chances in data science.
7. Building credibility: projects, portfolios, networking, certifications and applying for remote roles
Once you have a good grasp of python for data science and the right tools, the next big step is showing what you can do. This is how you build trust with companies and find a great job, especially if you want to work remotely.
Your Projects and Portfolio: Showing Your Skills
Your portfolio is like your art gallery, but for data projects. It’s where you put your best work using python for data science to show what you’ve learned. Here’s what makes a good portfolio:
- Real-world problems: Pick projects that solve actual problems. Maybe you analyze public data about traffic patterns, or predict house prices. These types of projects show you can use your skills to make a difference.
- Show your code: Use tools like Jupyter Notebooks (which we talked about before) to present your code, your findings, and your notes all in one place. Make sure your
python basicsare strong and your code is easy to read. - Explain your choices: Don’t just show the result. Explain why you chose certain methods or tools. This tells employers you can think through problems, not just copy solutions.
- Impact matters: Highlight what your project achieved. Did it save money? Make things faster? Uncover a hidden trend? Employers love to see the value you can bring.
Finding Remote Data Roles in 2026
The way people get data science jobs has changed in 2026 [Breaking Into Data Science in 2026: What Actually Works Now]. Many companies are now looking for remote data analysts and scientists [This is how you’ll become a REMOTE Data Analyst in 2026 (FULL …]. Here’s how to look for these roles:
- Target the right companies: Look for companies known for having good remote work cultures.
- Use remote job boards: There are special websites just for remote jobs. Use them to find specific
python for data scienceroles. - Network: Talk to people already working in data science. Go to online meetups or join professional groups. Sometimes, the best jobs come from knowing someone.
- Tailor your application: Make sure your resume and cover letter clearly show your skills in
python for data scienceand mention your experience with remote-friendly tools.
Earning and Growing in Data Science
Data science is a strong career choice, even for beginners, because businesses always need skilled people who can work with data [Data Science in 2026: Myths Debunked & Top Careers]. For those looking to switch careers, data science offers good opportunities and growth paths [Career Change to Data Science 2026].
When you get job offers, think about the whole package. Look at the salary, yes, but also consider:
- Learning chances: Will you get to learn new things or improve your
python for loopskills? - Work-life balance: Does the remote role offer the flexibility you want?
- Team and culture: Do you feel like you’ll fit in and be supported?
A good foundation in python basics, combined with a strong portfolio and smart job hunting, can lead to a rewarding career in python for data science.
Summary
This article explains why Python is the top choice for people breaking into data science and how to use it to win remote jobs in 2026. It walks through the main data roles (analyst, data scientist, ML engineer, MLOps), the employer expectations at different levels, and a clear learning path from Python basics to machine learning. You’ll learn which core skills to prioritize—syntax, control flow, functions, NumPy, Pandas, and Scikit-learn—how to clean and validate data, and how to make effective visualizations with Matplotlib, Seaborn or Plotly. The guide covers practical tooling (Jupyter, VS Code, Git), cloud options like Colab, and how to prepare reproducible projects and shareable portfolios. It also shows when to add machine learning, how to package and deploy work, and the best ways to demonstrate credibility for remote hiring. After reading, you’ll have a concrete roadmap to build projects, pick tools, and present your skills to employers.

Door to Door Sales Skills Lead to a Remote Appointment Setting Career

Launch Your Remote Tradeline Sales Appointment Setter Career